Read website logs
Use the access log, event log and HTTP platform log to find the cause of a problem.
When a website returns an error, restarts or behaves strangely, the reason is almost always in one of its logs. You find them in the Control Panel under Websites → your website → Logs.
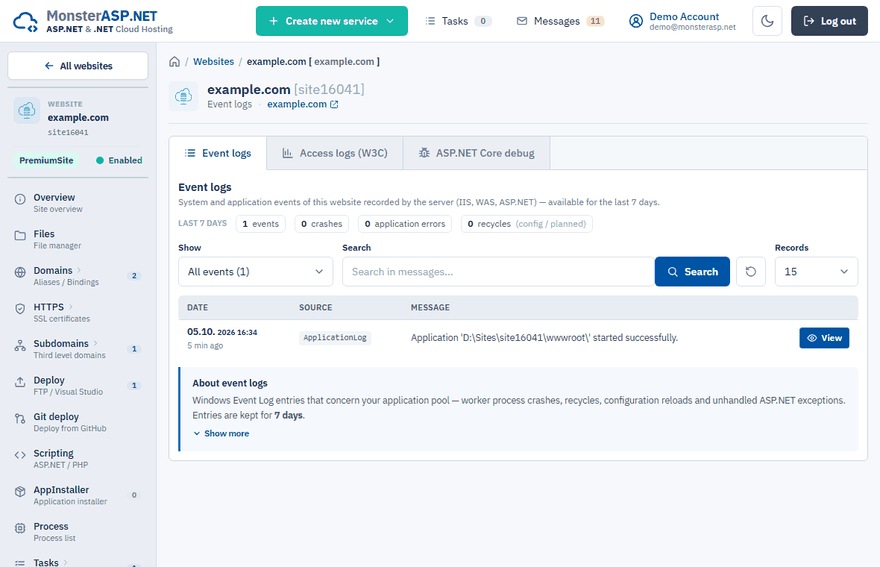
| Log | What it contains | Use it when |
|---|---|---|
| Event logs | Crashes, recycles and application errors of the last 7 days. | The application fails, restarts or returns error 500. |
| Access logs (W3C) | Today's requests with status codes and IP addresses. | You want to see who requested what and with which result. |
| ASP.NET Core debug | The standard output (stdout) of your .NET application. | An ASP.NET Core application does not start. |
| HttpPlatform debug | The standard output of a Node.js / SSR application. | A Node.js application does not start. |
Event logs
Event logs are system and application events of your website recorded by the server. Entries are kept for 7 days. Filter them with Show and click View to read the full text of an event.
| Event | Meaning |
|---|---|
| Application Error | An unhandled exception or configuration error inside your application. Open the event to read the full stack trace. |
| AppPool Restart | The worker process terminated unexpectedly (native crash, stack overflow, fatal error) and a new one was started. |
| AppPool Recycled | A planned recycle, typically after a deployment with app_offline.htm. Harmless. |
| AppPool Updated | The pool was recycled because its configuration changed — runtime version, bitness, environment variables or web.config edits. |
Tip
In the event detail click Copy message and paste the text into your support ticket. It saves a lot of questions.
Access logs
The Access logs (W3C) tab shows today's access log of the web server, newest records first.
- Up to 5000 newest records are shown. Times are server time.
- Filter by Status (200, 301, 404, 500…) or search by URI, IP address or method.
- Data is cached for 5 minutes. Click Reload to fetch a fresh log.
- If today's log file exceeds 200 MB, it is not parsed in the Control Panel. Download it over FTP instead.
Download the raw log files
Switch Access logs on FTP to Enabled. The log files in W3C format then appear in the /access_logs directory of your FTP account and you can analyze them with any log analyzer.
ASP.NET Core debug and HttpPlatform debug
These two tabs capture everything your application writes to its standard output, including startup errors and stack traces that the default error page does not show. They are described in separate articles: