Check resource usage
Read the CPU, memory and disk charts of a website or database.
The Resource page shows how much traffic your website handles and how much CPU, memory and disk its application pool uses over time. It is the first place to look when a website is slow or keeps restarting.
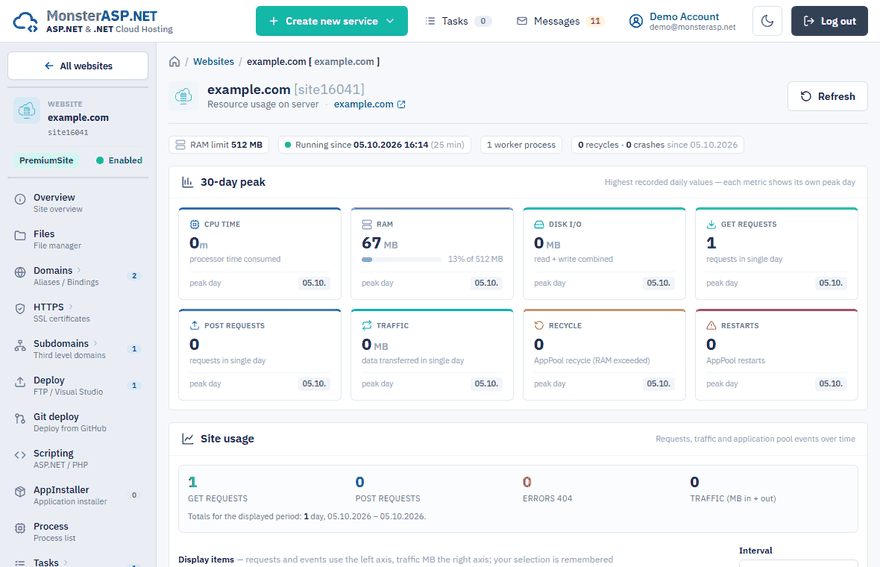
You find it in the Control Panel under Websites → your website → Resource.
The server samples every website once a minute and aggregates the values into hours, days, weeks and months.
Site usage
The first chart comes from the web server and shows requests, traffic and application pool events.
| Series | What it shows |
|---|---|
| GET, POST | Number of requests. |
| Error 404 | Requests for addresses that do not exist. |
| Traffic MB — In / Out | Data received and sent. |
| AppPool — Recycle | Restarts of the application pool. |
| AppPool — Crash | Unexpected terminations of the worker process — unhandled exceptions, stack overflows, native crashes. |
System usage
The second chart is measured on the worker processes of your application pool.
| Series | What it shows |
|---|---|
| Processes | Number of running processes. |
| CPU time [s] | Processor time consumed in the interval. It is not a percentage. |
| Memory MB — Used / Peak / Limit | Memory in use, the highest value seen in the interval and the limit of your plan. |
| Disk MB — Read / Write | Data read from and written to the disk. |
| Disk IO ops — Read / Write | Number of disk operations. |
The tiles above each chart summarize the selected period, for example CPU time, Memory peak and the Busiest point.
Work with the charts
- Use Interval to switch between Minutes, Hours, Days, Weeks and Months. Minutes or Hours are best for inspecting a spike in detail, Weeks or Months for the long-term trend.
- Click a series under Display items to show or hide it. Series with very different magnitudes are easier to compare when you switch the others off. Your selection is remembered.
- Click Refresh to load current data.
How to read the values
Memory peak reaches the limit
When the memory peak reaches the limit of the plan, the application pool is recycled. You see it in the Recycle series and as a reset of the memory curve. See Increase the memory (RAM) of a website.
High CPU time on an idle site
Sustained high values while nobody uses the site usually mean a busy loop, a runaway background job or an expensive request that is hit repeatedly.
AppPool crashes
Check the Event logs and the ASP.NET Core debug log for the cause — see Read website logs.
Related
- View and restart processes — what is running right now
- Application keeps restarting or loses sessions