Turn on ASP.NET Core debug logging
Enable the stdout log to see why your application fails to start.
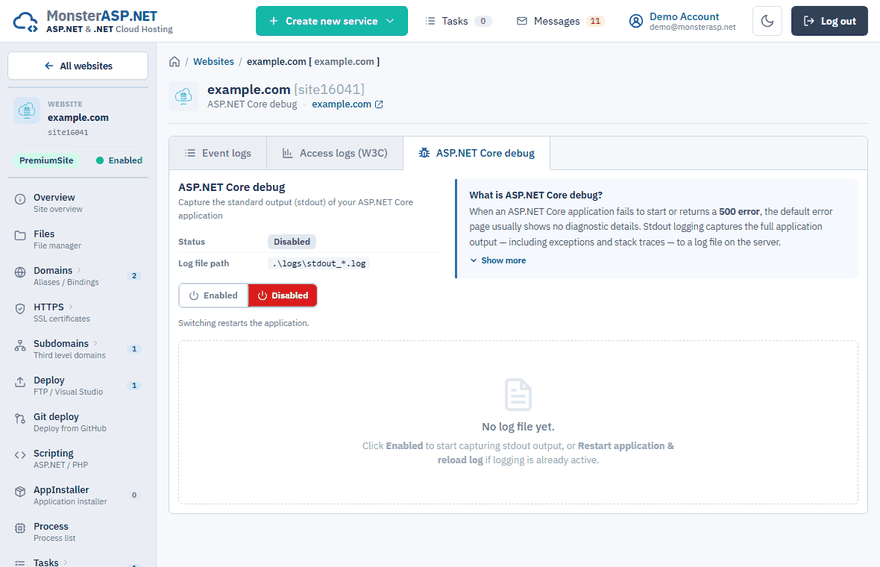
When an ASP.NET Core application fails to start or returns a 500 error, the default error page usually shows no details. Stdout logging captures the full output of the application — including exceptions and stack traces — into a log file on the server, and the Control Panel shows it to you.
Turn it on and read the log
Open the logs
Sign in to the Control Panel, go to Websites, select your website and choose Logs in the left menu.
Open the ASP.NET Core debug tab
Click ASP.NET Core debug.
Enable logging
Switch Status to Enabled. This turns on stdout logging and restarts your application.
Read the log
Wait a moment. The output of the application appears below, with the newest lines at the bottom. If the log is empty, click Restart application & reload log to force a new capture.
Disable logging
When you are done, switch Status back to Disabled. Logging is turned off and the application restarts cleanly.
Warning
Stdout logging slows the application down and the log files take up disk space of the website. Always disable it once you finish debugging.
Working with the log
- Reload log reads the current log file again.
- Restart application & reload log restarts the application and creates a new log file, so you get a fresh capture of the startup.
- Copy log copies the whole log to the clipboard — useful when you open a support ticket.
The log files are written to .\logs\stdout_*.log inside your website. You can also download them over FTP from the /wwwroot/logs directory, or open them in the browser with WebFTP.
The page says the application was not detected
The message ASP.NET Core application was not detected on your website means that the website does not contain a web.config with the aspNetCore section. Check that:
- the application is published to
/wwwroot, not to a subfolder, - the upload is complete and includes the
web.configgenerated by the publish.
For Node.js applications use Node.js debug logging instead.
What to look for
The log starts with the output of the application startup. An unhandled exception is listed with its type, message and stack trace — the first lines usually name the cause, for example a configuration file that cannot be parsed or a database that cannot be reached.
The most common causes and their fixes are described in HTTP Error 500 – the application failed to start.