Node.js debug logging
This article provides information on how to access Node.js debug logs.
ASP.NET / .NET freehosting
If you don't already have our ASP.NET / .NET freehosting, sign up for FREE at https://MonsterASP.net/.
Node.js debug logs
If unexpected exceptions have occurred in your Node.js application we recommend that you first check Logs in Control panel. For each log entry you can view details and find out why your application is not working and what happened.
If you can't find anything in Control panel you need to check debug logs where exceptions are logged. You can easily enable debug mode from our hosting Control panel.
1) Control panel
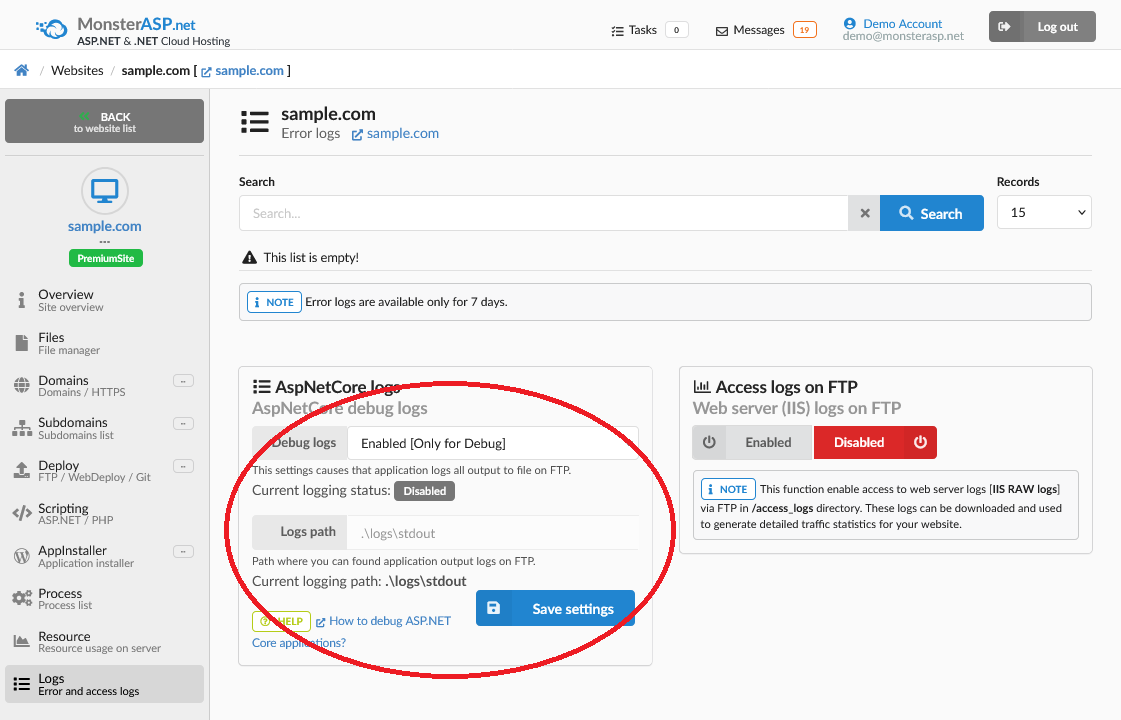
Go to Detailed Settings of your Website and click on Logs in menu on left. Here in HttpPlatform logs section enable Debug logs and click Save.

This setting enables Node.js application to start saving output logs to .\logs\node files on FTP.
After changing this setting we recommend restart AppPool for take to effect.
2) WebFTP access
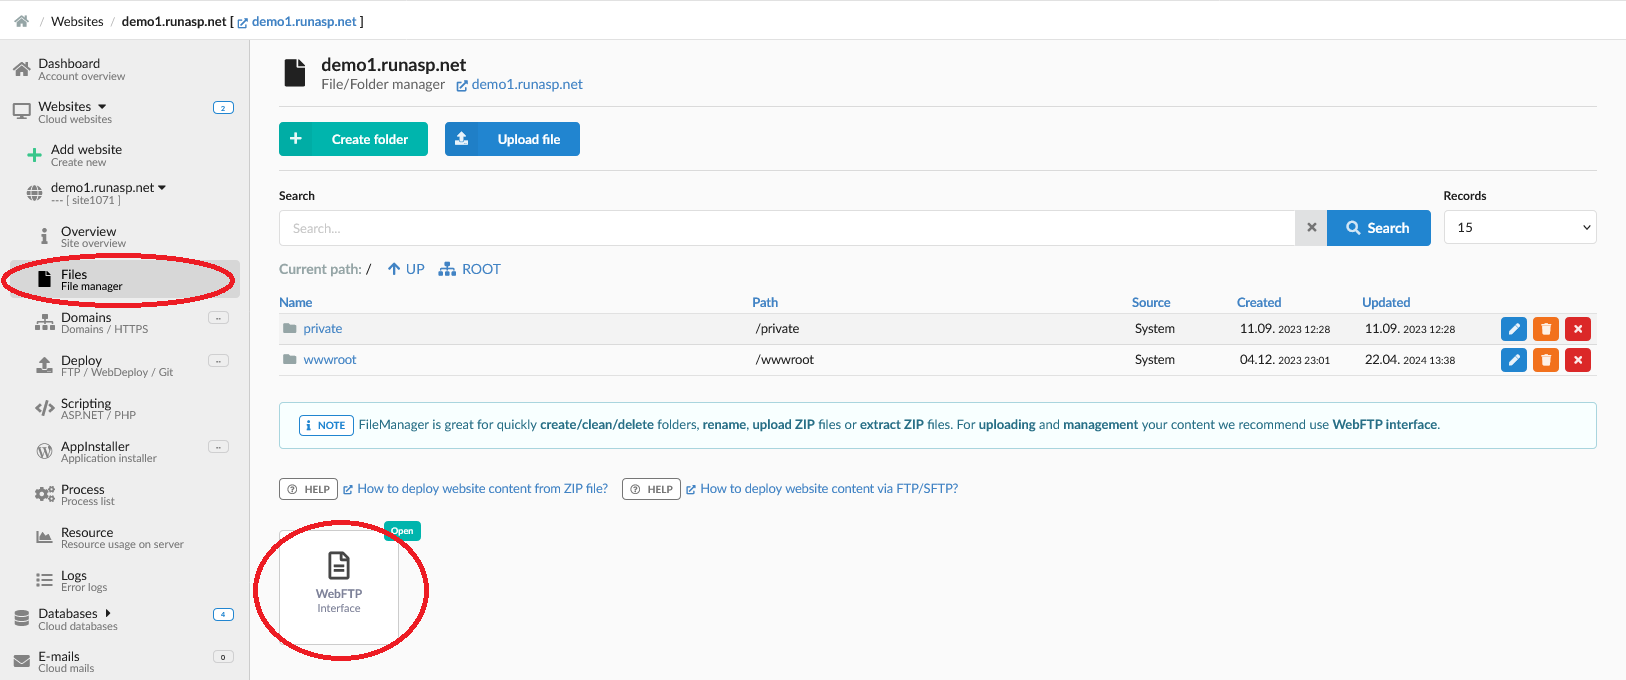
Now your application is storing debug logs on FTP and you need to access and view these log files. Easiest way to do this is to use WebFTP access. Click on Files in menu on left and there click on WebFTP icon.

3) WebFTP interface
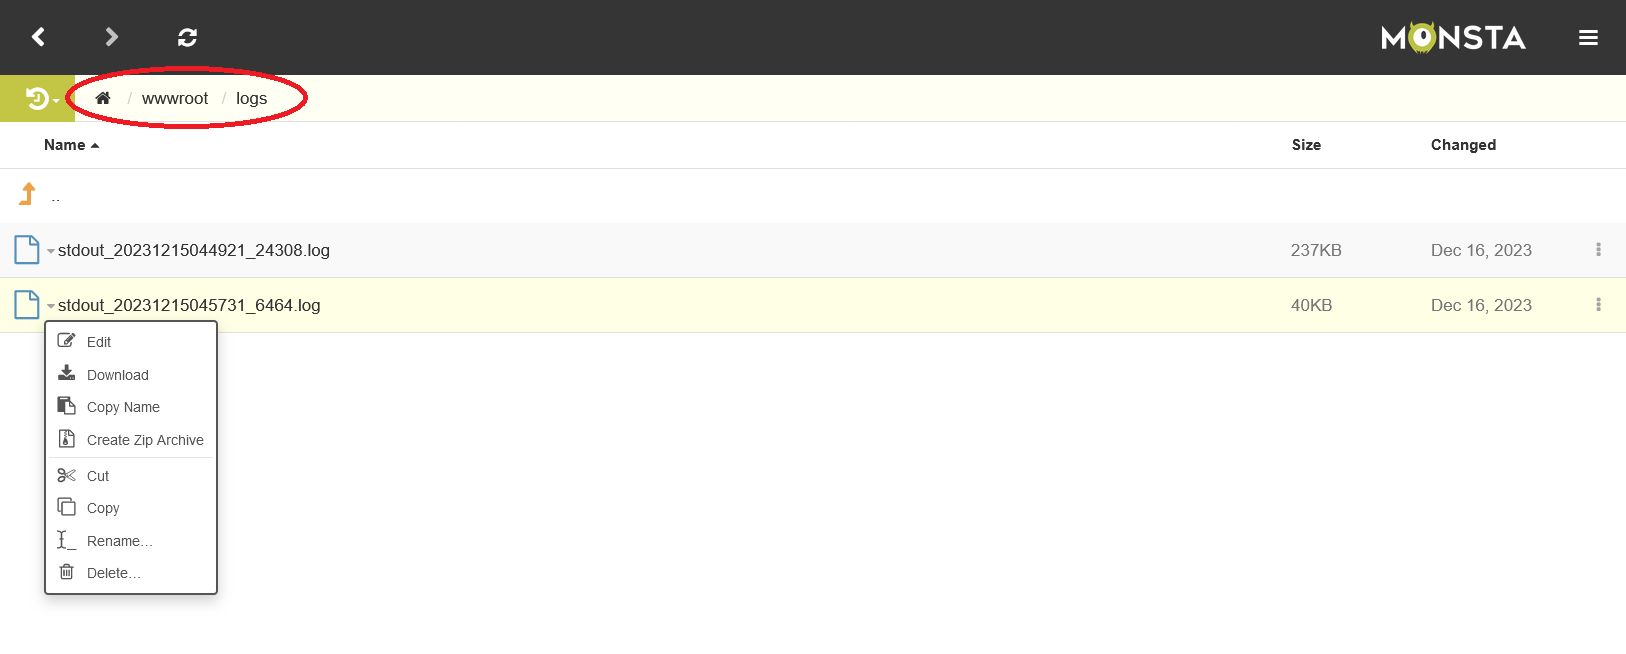
After opening WebFTP interface, navigate to /wwwroot/logs/ directory and you will find there ASP.NET Core debug log files, which you can view directly using Edit option.

Debug logging is performance and disk intensive. It is important to turn it OFF again when you are finished.
