HTTP 500 Error
This article contains information how to debugging your site.
If your requests return status code 500, it means that your application ended with errors.
Option 1: Screenshot from server
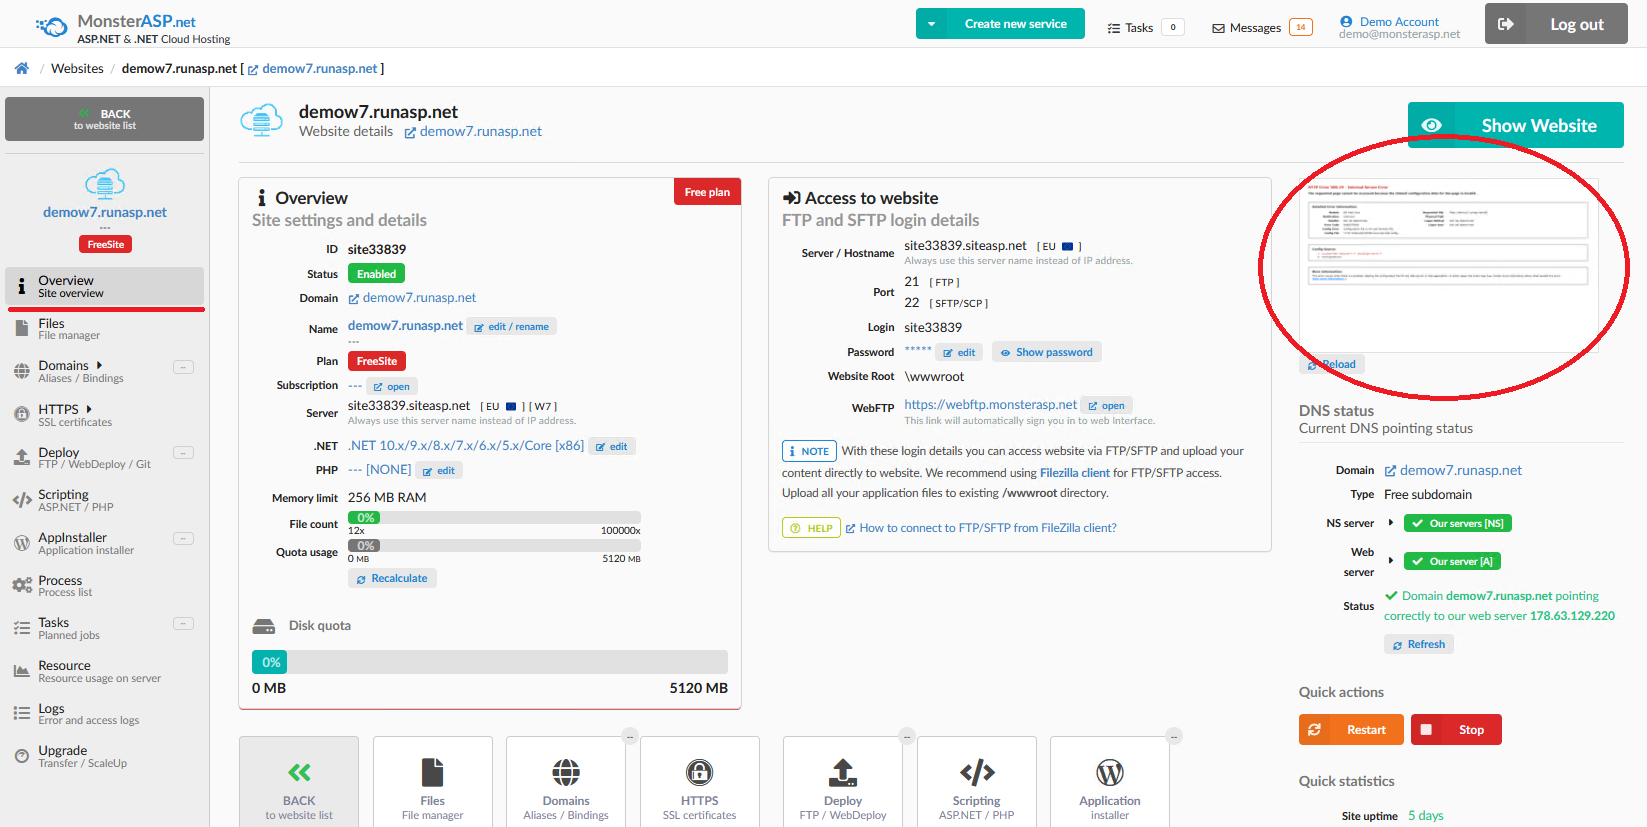
Web browsers don’t always show detailed errors and may display only a general message that doesn’t give you any useful information. That’s why in our Control Panel, you can see a server screenshot that makes it easier to identify the problem.
You can find the screenshot for each of your websites directly in the Overview.
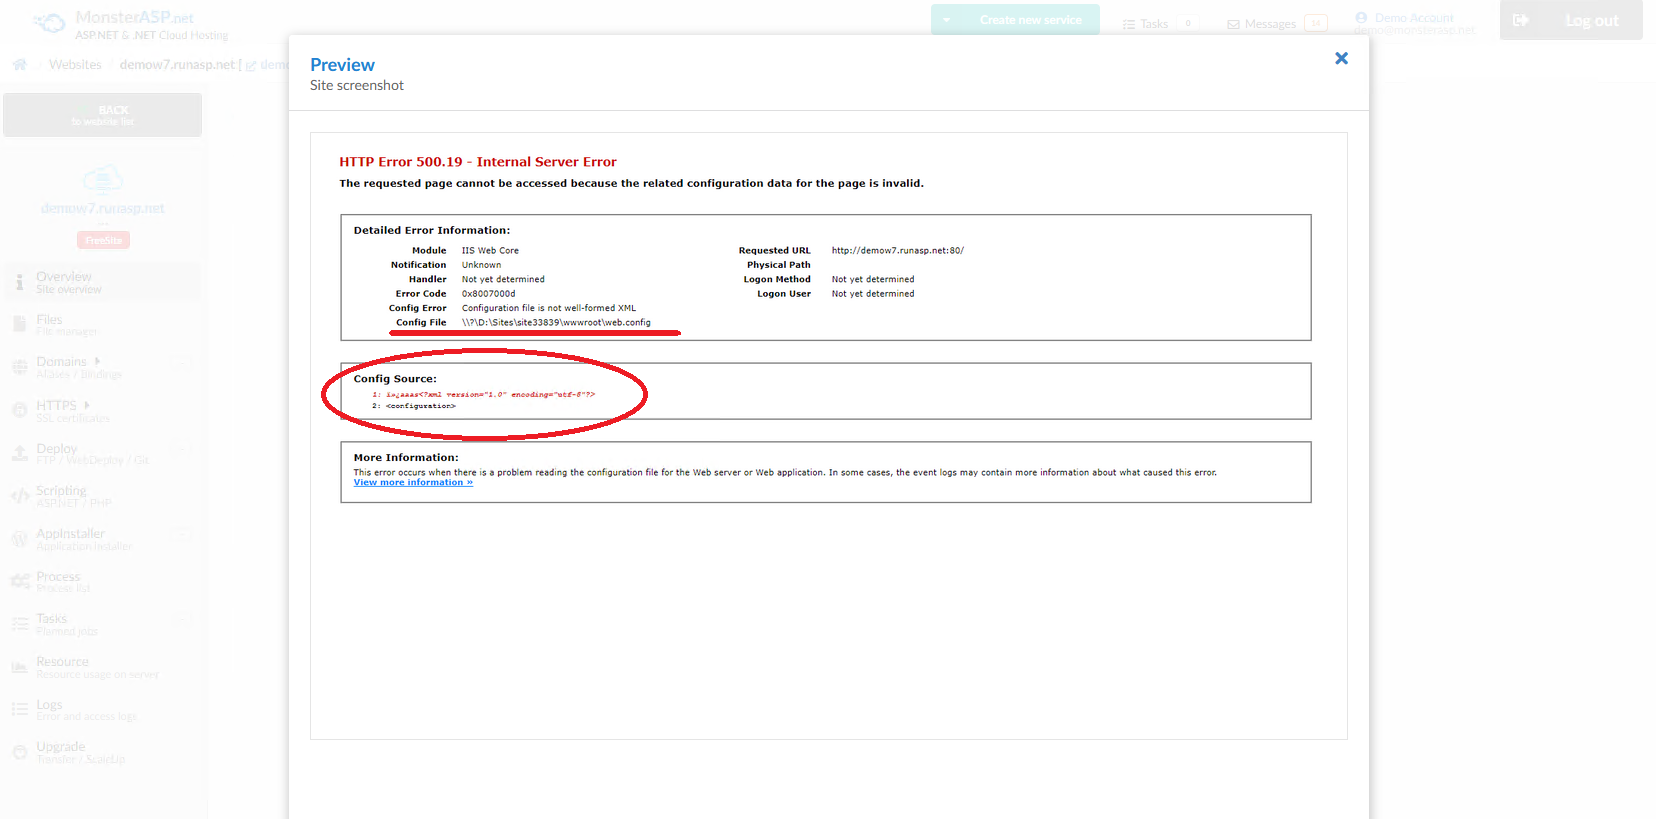
Preview
By clicking on the server screenshot, we can see in this example that the error is in the web.config file. At the beginning of the file, there are invalid characters caused by editing the web.config file improperly, for example, using Notepad.
Solution
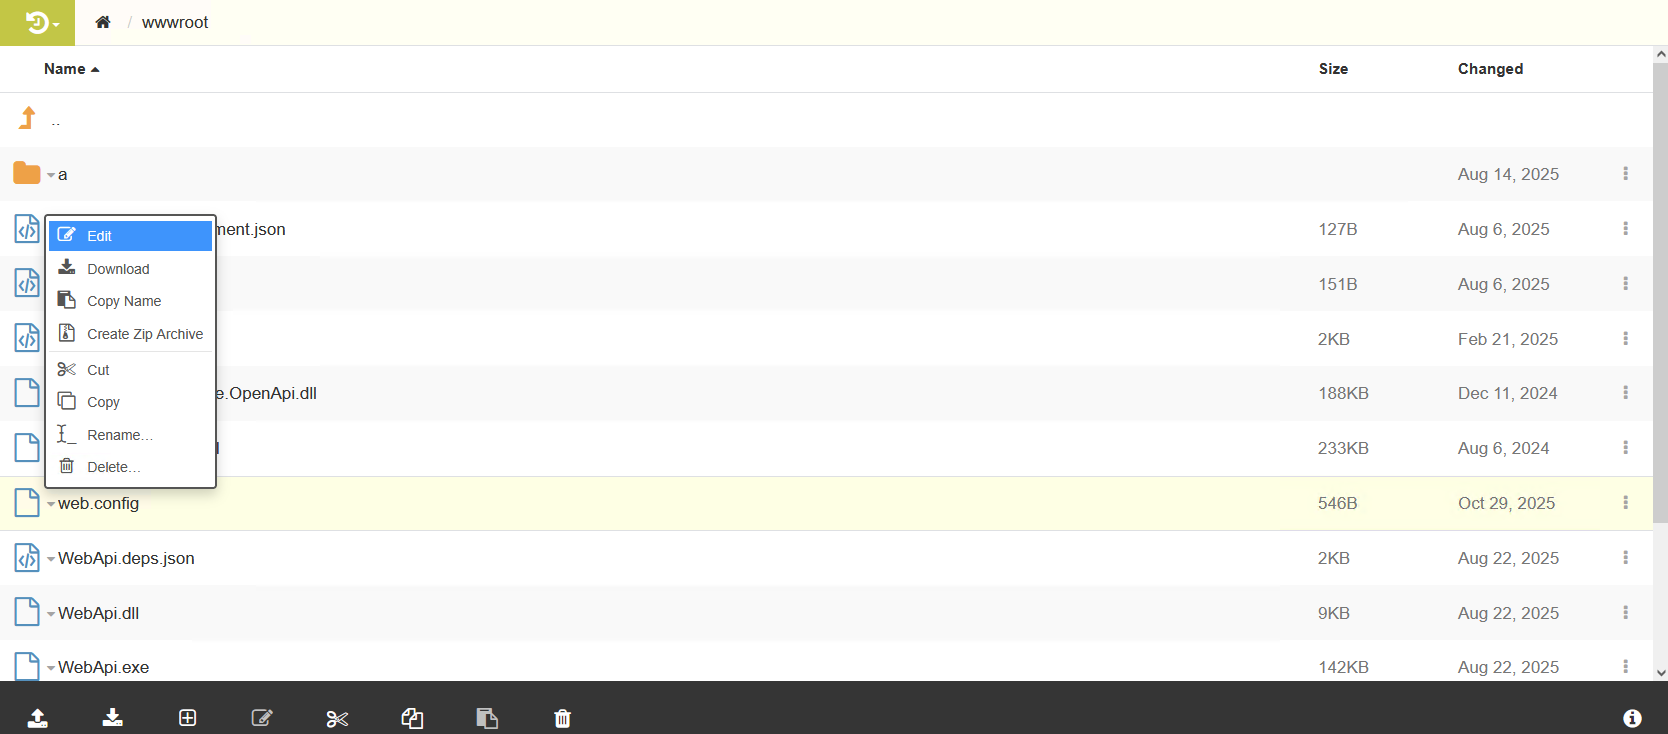
We can easily fix this issue via Web FTP, directly from the Control Panel. By clicking on WebFTP, open your web hosting FTP → wwwroot → web.config, then right-click and select EDIT.
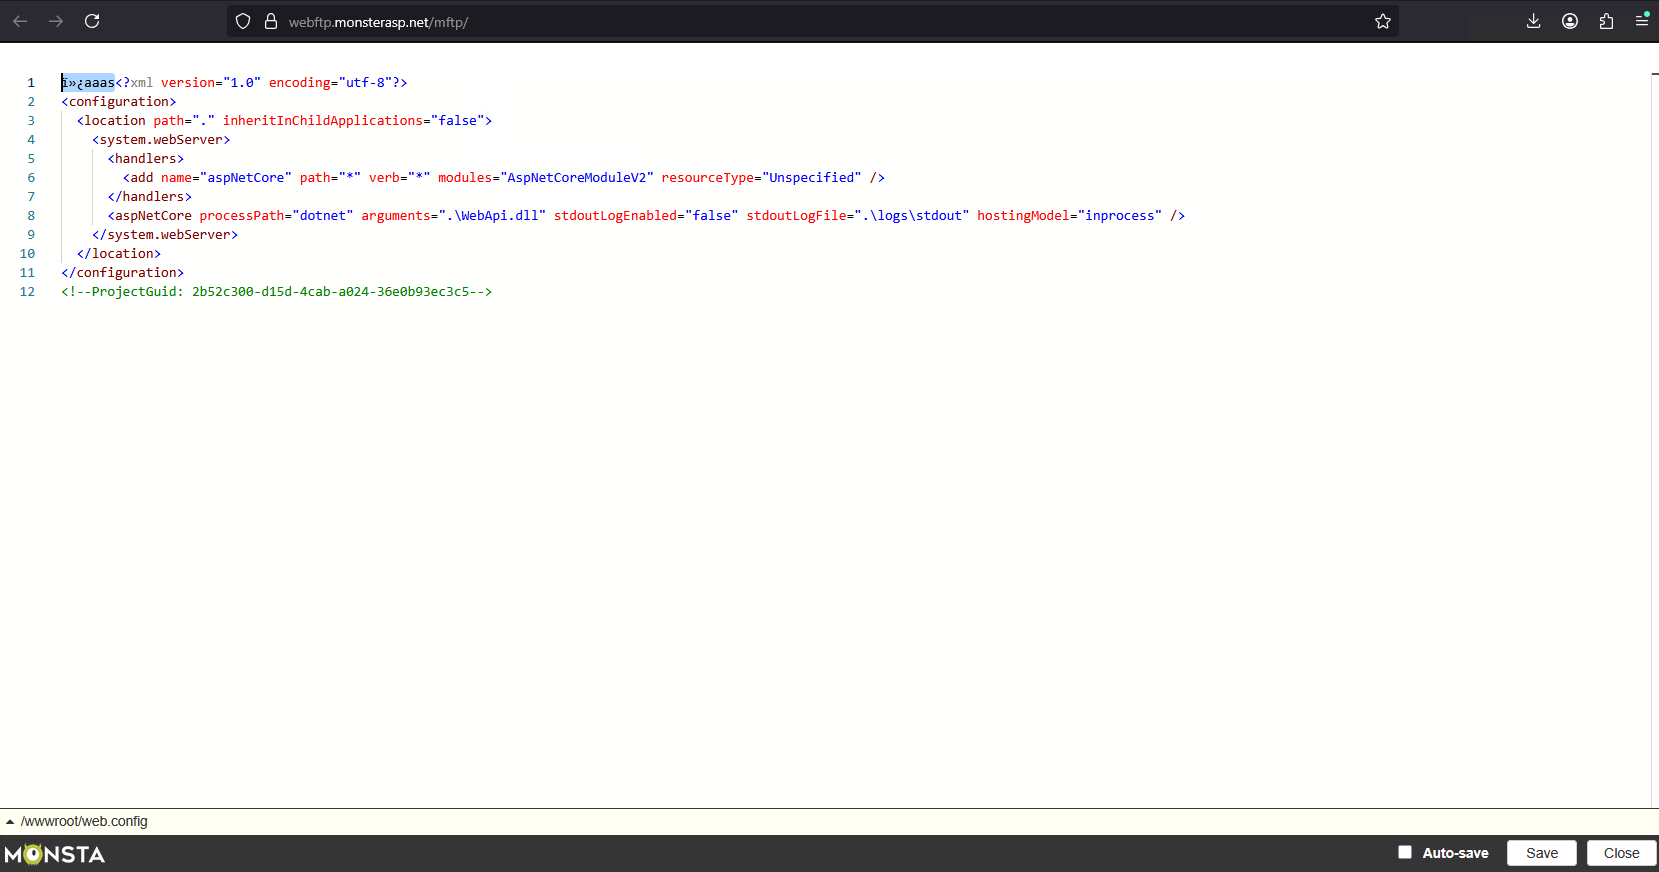
After opening the file, delete the unwanted characters from web.config and click Save. Then go back to your website overview in the Control Panel and click Reload on the screenshot.
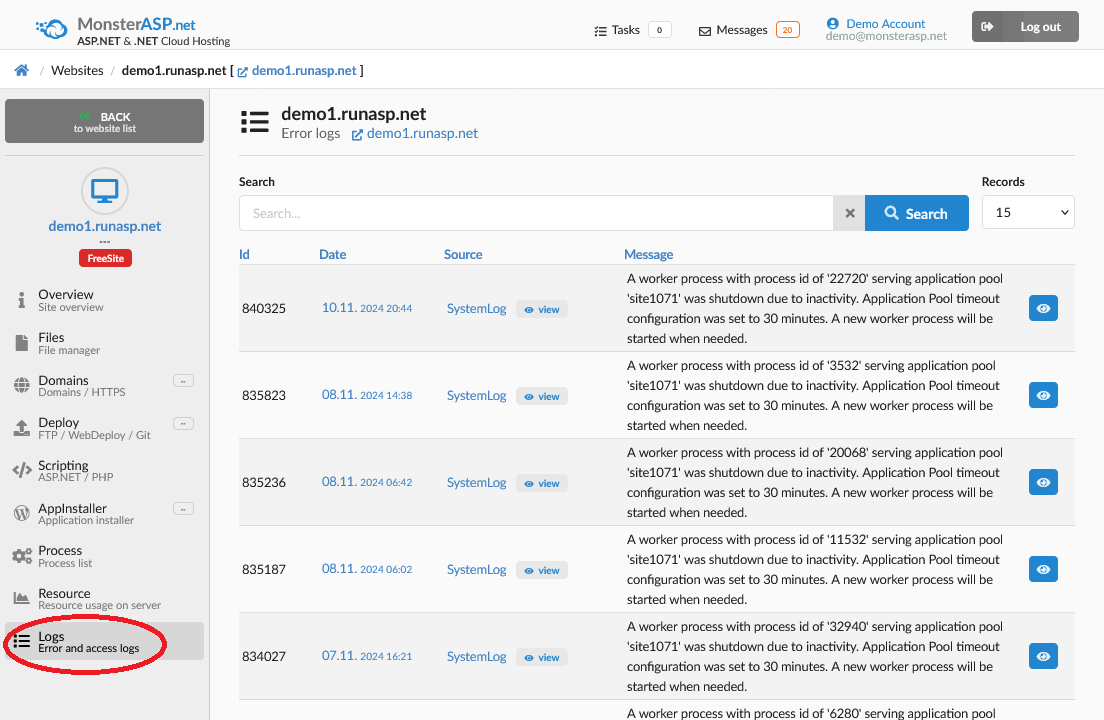
Option 2: Check Logs
Go to the Control Panel.
Look at the logs to see details of the error.
Option 3: Enable ASP.NET Core Debug Logging
If unexpected exceptions have occurred in your ASP.NET Core application we recommend that you first check Logs in Control panel. For each log entry you can view details and find out why your application is not working and what happened.
Go to Overview of your Website and click on Logs in menu on left. Here in AspNetCore logs section enable Debug logs and click Save.
More informations you can find here: ASP.NET Core debug logging